Scrooge: Analyzing Yahoo Financial Data In DuckDB
TLDR: Scrooge is a third-party DuckDB extension focusing on financial data analysis. Besides implementing statistical and time-series functions catered to financial data. It allows users to directly query Yahoo Financial’s historical data with DuckDB’s SQL complete OLAP engine.
Scrooge lets users directly query financial data using DuckDB’s extensive statistical library. It also facilitates data analysis by leveraging DuckDB’s extensive integration with the Python eco-system. This makes it possible for users to quickly visualize their data or even train ML models on it (e.g., through DuckDB’s Tensorflow and Pytorch integrations). You can download a colab with all the code used in this blog post here.
Note: Don’t take the examples in this blog post as financial tips! I’m usually only good at losing money fast.
Install and Load Scrooge
To facilitate the usage of Scrooge, binaries are produced for Linux, macOS, and Windows platforms starting from DuckDB’s 0.7.0 version. These binaries are available in an S3 bucket. Since DuckDB’s CI does not automatically distribute Scrooge, it is not a signed extension. Users must always pass the unsigned option when starting a database connection.
import duckdb
# Starts a memory database, with the configuratin that allows for unsigned extensions
con = duckdb.connect(':memory:', config={'allow_unsigned_extensions' : 'true'})

# Install the HTTPFS - DuckDB Extension. This is a dependency of the scrooge extension.
con.execute("INSTALL 'httpfs'")
# Loads the HTTPFS - DuckDB Extension.
con.execute("LOAD 'httpfs'")
# Sets a custom S3 bucket, where DuckDB will look for non-official extensions.
con.execute("SET custom_extension_repository='scrooge-duckdb.s3.us-west-2.amazonaws.com/scrooge/s3_deploy';")
# Install Scrooge
con.execute("INSTALL 'scrooge'")
# Loads Scrooge
con.execute("LOAD 'scrooge'")
The Yahoo Finance Function
In this extension, I’ve implemented a scanner that directly retrieves data from Yahoo Finance and transforms it into a DuckDB Table. The function takes 4 parameters.
1) The symbol of the financial object we want to query (e.g., ^GSPC is the symbol for the S&P500 index).
2) The date start period we want to analyze.
3) The date end period we want to analyze.
4) The interval we want to fetch data from yahoo. We currently support: “1d” for 1 day. “5d” for 5 days. “1wk” for a week. “1mo” for a month. “3mo” for 3 months.
An example of its usage is:
select * FROM yahoo_finance("^GSPC", "2017-12-01", "2017-12-10", "1d")
This returns a table with 7 columns.
1) Date: The reference date of the row.
2) Open: Refers to the price at which the financial object started trading at the beginning of the trading day.
3) High: The highest value of the financial object on that trading day.
4) Low: The lowest value of the financial object on that trading day.
5) Close: Refers to the final price at which the financial object was traded at the end of the trading day.
6) Adj Close: The adjusted closing price of the financial object. It is calculated by considering any corporate actions that affect its price, such as stock splits, dividends, or rights offerings.
7) Volume: The total number of shares or contracts of the financial object traded that day.
Additionally, you can also submit a list of financial symbols, instead of only one financial symbols, to the yahoo_finance function. This will return the same 7 columns as the previous example, with one additional Symbol column, with the respective symbol. As an example:
select * FROM yahoo_finance(["^GSPC","BTC-USD"], "2017-12-01", "2017-12-10", "1d")
Candle-Stick Aggregation
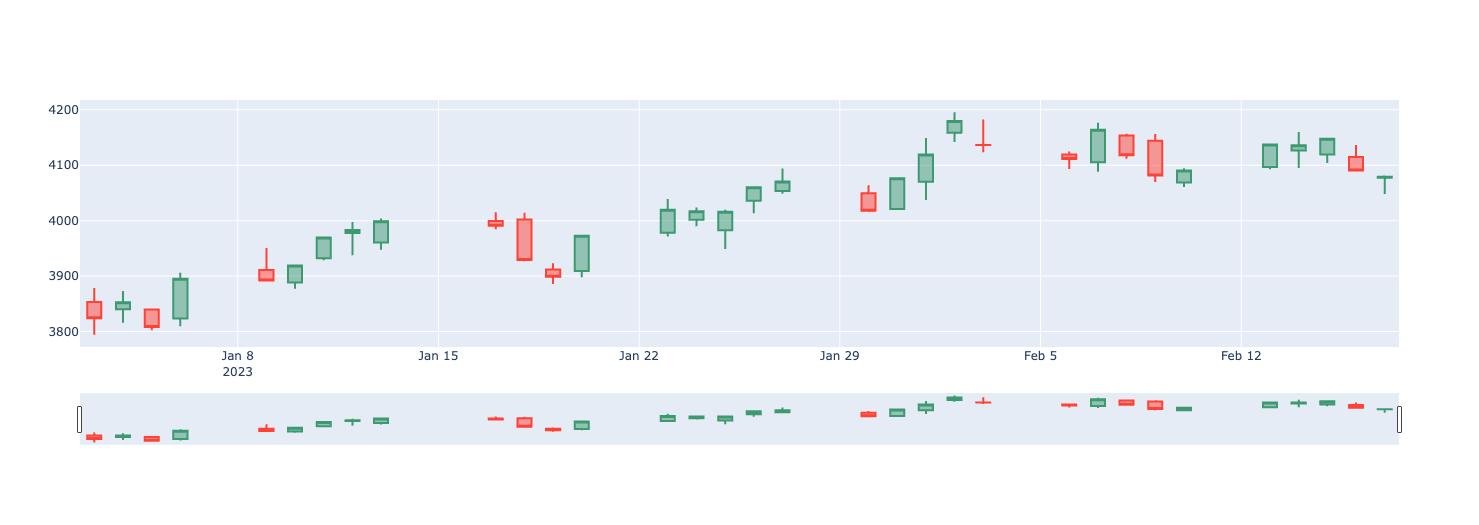
The table is already created in the perfect format to be plotted on a candle stick figure. Due to DuckDB’s integration with Pandas, we can easily plot the candle stick aggregation for the S&P500 this year.
# Plot library
import plotly.graph_objects as go

# DuckDB query using yahoo_finance, it returns a Pandas Dataframe
df = con.execute("select * FROM yahoo_finance('^GSPC', '2023-01-01', '2023-02-18', '1d')").df()

# Directly plotting the candlestick aggregation
go.Figure(data=[go.Candlestick(x=df['Date'],
                open=df['Open'],
                high=df['High'],
                low=df['Low'],
                close=df['Close'])]).show
The result of our Candle-Stick aggregation can be seen below:
Volatility Analysis
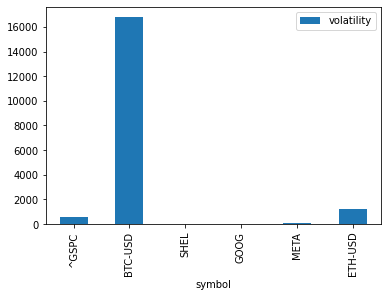
Some DuckDB functions are renamed in this extension to fit a more financial lingo. In this case, we can use the volatility function to calculate the degree of variation or fluctuation in a financial object’s price or value over time.
In this example, we cache 2 years of financial information on the S&P500, Bitcoin, Shell, Google, Meta, and Ethereum and plot their volatility over two years.
# We can also cache information retrieved from yahoo finance by directly storing it on a table
con.execute("create table stocks as select * FROM yahoo_finance(['^GSPC','BTC-USD', 'SHEL', 'GOOG', 'META','ETH-USD'], '2020-01-01', '2023-02-18', '1d')")
# Returns grouped information of the volatility of each object
df = con.execute("select symbol, volatility(close) as volatility from stocks group by symbol").df()
# Plots a bar chart
df.plot.bar(x="symbol", y="volatility")
As expected, crypto-assets’ casino lifestyle is dominating the chart’s visualization.
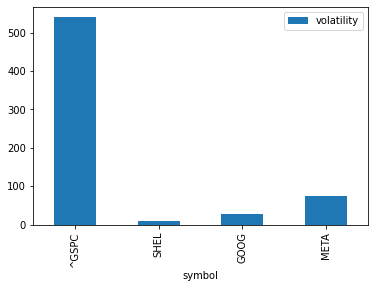
If we exclude the crypto-coins, we can see that more traditional-seasonal investments (Gas?) are not as volatile in the long term.
Correlation Analysis
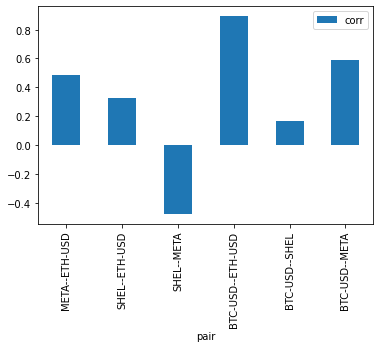
Of course, no wallet is safe if you accidentally put all your eggs in one basket. When analyzing what to buy, checking the correlation of your assets is a must. DuckDB implements a correlation function that we can directly use in our query. In this example, we analyze the correlation of all combinations of Bitcoin, Shell, Meta, and Ethereum.
import itertools
stocks = ['BTC-USD','SHEL','META','ETH-USD']
sql = ''
all_pairs = list(itertools.combinations(stocks,2))
# Generate all of our stocks correlational combinations
for i in range(len(all_pairs)):
  # Calls the corr function on columns of each stock, joined by the date
  sql += f"select concat('{all_pairs[i][0]}','--','{all_pairs[i][1]}') as pair, corr(stock_1.close,stock_2.close) as corr from (select date,close from stocks where symbol = '{all_pairs[i][0]}') as stock_1 inner join (select date,close from stocks where symbol = '{all_pairs[i][1]}') as stock_2 on (stock_1.date = stock_2.date)"
  # Union on all pairs
  if i != len(all_pairs) - 1:
    sql+=" UNION "
# Retrieve a Pandas Dataframe
df = con.execute(sql).df()
# Plots a bar chart
df.plot.bar(x="pair", y="corr")
To (I hope) no one’s surprise, it seems that ETH and BTC are highly correlated; hence buying both coins will be a poor diversity strategy. At the same time, Shell and Meta present a negative correlation, which can contribute to a more diverse wallet.
Future and Contributing
This project started as an eat-your-own-dog-food kind of thing that I was doing in my free time. I wanted to experience implementing a DuckDB third-party library to analyze how feasible it is for users to create their libraries.
However, I have been investing in the financial market since my early 20s, and I have spent much time reading financial reports when deciding which stocks to buy. I hope to extend Scrooge to help others analyze financial data directly through SQL without hassle. It is a pet project for some of the colder Amsterdam weekends. If you are passionate about DuckDB and finance and want to contribute to Scrooge, please email me at pedroholanda@gmail.com!
Many other functions that are useful for financial data analysis are currently on my roadmap. In particular, functions that can help with portfolio creation. For example, the expected return of stocks, the shape ratio, and the stock’s sensitivity to the overall market.
Also, in this blog post, I only talk about querying the historical data of Yahoo Finance. Their API is much deeper than that, and you can also consolidate more fine-grained information on the companies, data on stock quotes, company news, financial statements, insider trading, analyst recommendations, and dividend and earnings information. All of these can be combined into a more complex analytical pipeline.