Scrooge McDuck: A DuckDB Extension for Financial Data Analysis (Demo)
TLDR: DuckDB can easily be extended by creating external libraries that are loaded at runtime. These extensions allow third parties to develop new functions and data scanners catered for their needs. In this post, I demonstrate Scrooge McDuck: an extension designed to facilitate the analysis of financial data.
DuckDB is a new analytical data management system that is designed to run complex analytical SQL queries within other processes. DuckDB supports a variety of aggregagation/scalar functions and data scanners (e.g., CSV, JSON, Parquet readers), which allow users to easily scan different data sources and manipulate its data in various ways. However, users can also take advantage of functions and scanners designed specifically for their domain-specific tasks.
DuckDB’s extension ecosystem enables this capability. With it, advanced users can define their functions and scanners, which can take full advantage of DuckDB’s compression, vectorization, and parallelization.
In this post, I present Scrooge McDuck, a third-party financial library demo that implements extra aggregation functions that allow users to create candle-stick charts. This extension currently implements three extra DuckDB functions:
- FIRST_S(A::{NUMERIC_VALUE}, B::{TIMESTAMPTZ}): It returns the value of column A based on the earliest timestamp value of column B.
- LAST_S(A::{NUMERIC_VALUE}, B::{TIMESTAMPTZ}): It returns the value of column A based on the latest timestamp value of column B.
- TIMEBUCKET(‘A::{TIMESTAMPTZ}, B::{INTERVAL} ): Creates timestamp buckets on column A, with ranges on the Interval of value B.
Demo
To reproduce this demo, you must have:
- A build of Scrooge McDuck. See how on this readme
- The latest python libraries of DuckDB and Plotly
pip install duckdb plotly - Download and unzip the example [dataset] (https://github.com/pdet/Scrooge-McDuck/raw/main/crypto_sample.zip)
To start, we need to load the libraries we will be using in this tutorial.
import duckdb
import plotly.graph_objects as go
Loading Scrooge McDuck
To load Scrooge McDuck, we simply have to execute the LOAD command together with the compiled path of the library.
con = duckdb.connect()
con.execute("LOAD 'build/release/scrooge.duckdb_extension';")
Creating Table
We only have one table in our dataset, the crypto_ticks, that holds the price (to USD) of a cryptocurrency at a given time.
con.execute("""CREATE TABLE crypto_ticks (
               "time" TIMESTAMPTZ,
               symbol TEXT,
               price DOUBLE PRECISION,
               day_volume NUMERIC
            );""")
Loading Data
Our dataset is a CSV file; hence to load it we simply need a COPY ... FROM... statement.
con.execute("COPY crypto_ticks FROM 'tutorial_sample_tick.csv' CSV HEADER;")
Generating Candle-Stick Aggregations
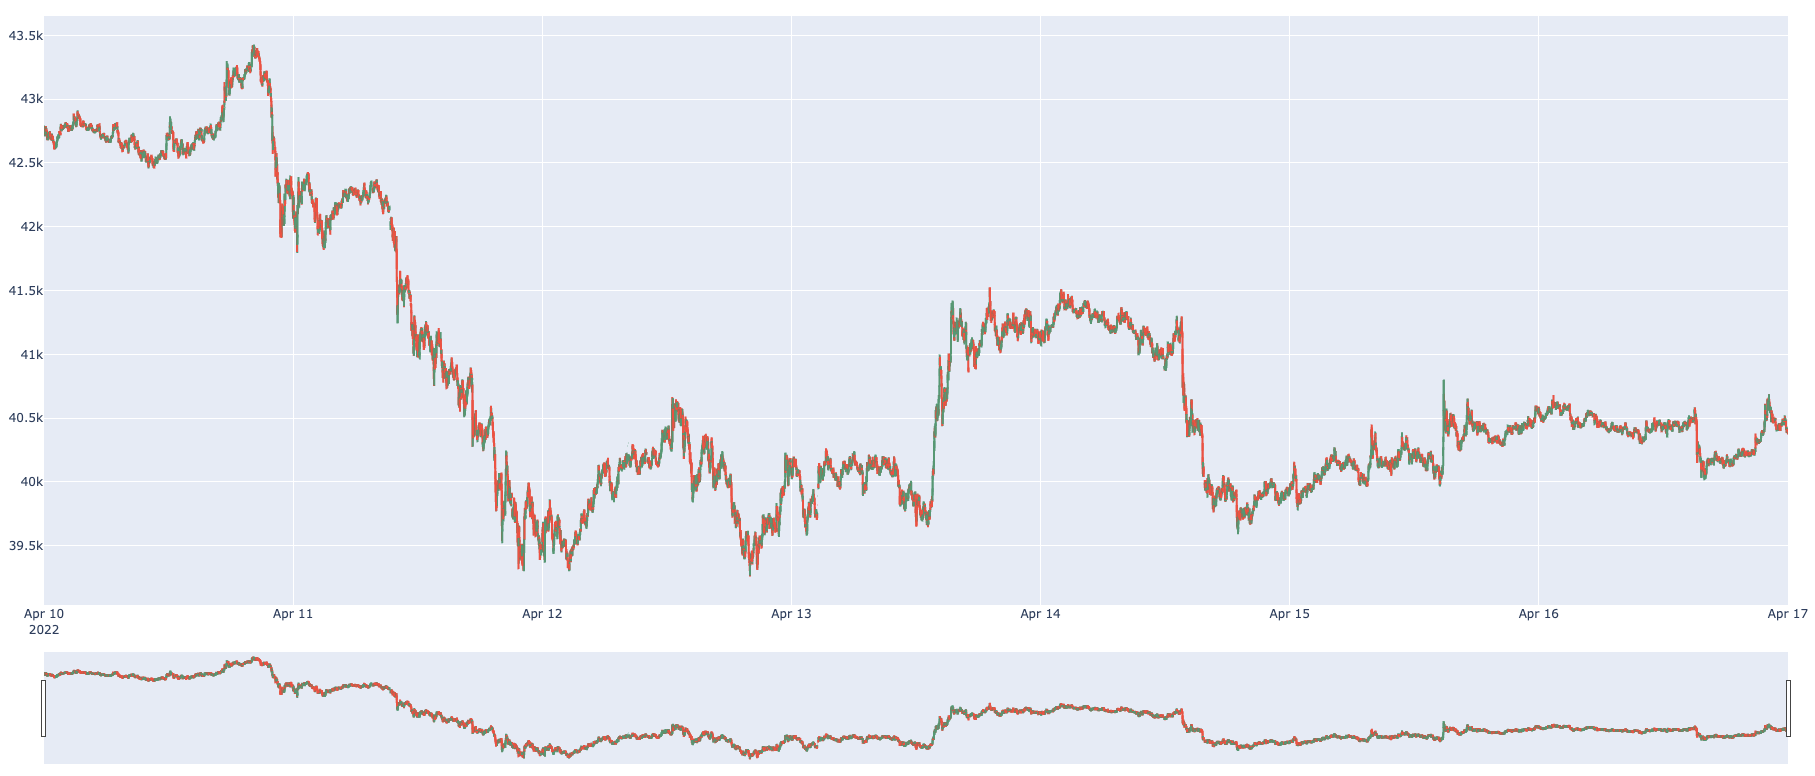
Here we generate our main aggregation using the domain-specific functions from Scrooge McDuck. To generate these aggregations, we must take, from within our time bucket, the open and close values of a cryptocurrency and their high and low values. In this case, we focus only on the week from 10-17 of April 22.
Since DuckDB has a tight integration with Pandas, to facilitate plotting we export our query result to a Pandas Dataframe with the .df() function.
df = con.execute("""SELECT TIMEBUCKET(time,'1M'::INTERVAL) AS bucket,
                           FIRST_S(price, time) AS "open",
                           MAX(price) AS high,
                           MIN(price) AS low,
                           LAST_S(price, time) AS "close",
                    FROM crypto_ticks
                    WHERE symbol = 'BTC/USD'
                    AND time >= '2022-04-10'::TIMESTAMPTZ
                    AND time <= '2022-04-17'::TIMESTAMPTZ
                    GROUP BY bucket""").df()
Plotting
To plot, we use the Candlestick aggregation of Plotly on our generated dataframe.
fig = go.Figure(data=[go.Candlestick(x=df['bucket'],
                open=df['open'],
                high=df['high'],
                low=df['low'],
                close=df['close'])])
fig.show()
The result of our Candle-Stick aggregation can be seen below:
Conclusion and Feedback
In this blog post, I mainly showcased Scrooge McDuck, a DuckDB extension demo that focuses on implementing functions for financial data analysis. I also demonstrate how easy it is to create and use DuckDB third-party extensions, with them fully taking on the advantage of all state-of-the-art analytical techniques that DuckDB implements under the hood.
Scrooge McDuck is a demo to showcase the possibilities of DuckDB extensions, but it is also a project that I am particularly interested in. If you are a financial person and have any feedback on functions and scanners (e.g., maybe you want to scan the blockchain?), drop me an email, and I would be very happy to have a chat with you and understand your needs.